
Breathing.AI
Enhancing user experience for Northeastern University commuters
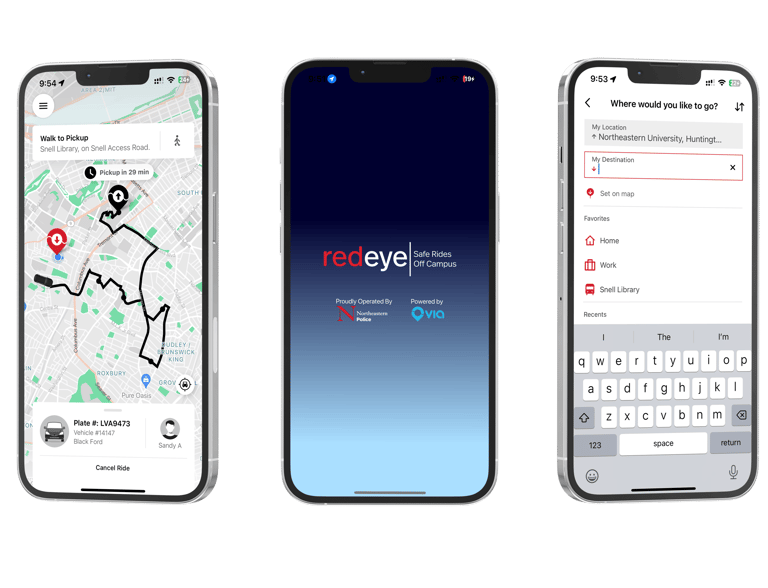
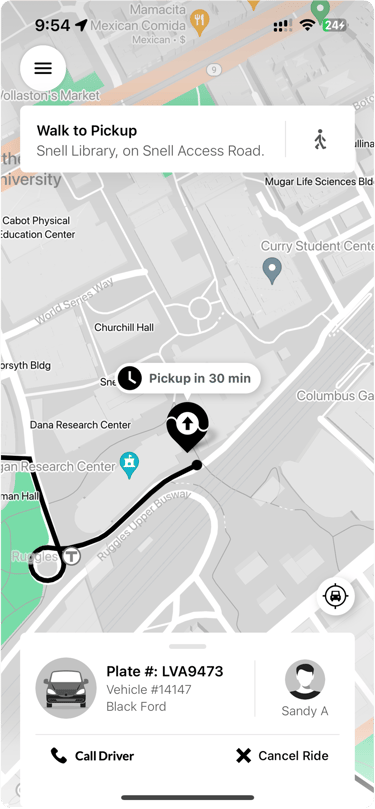
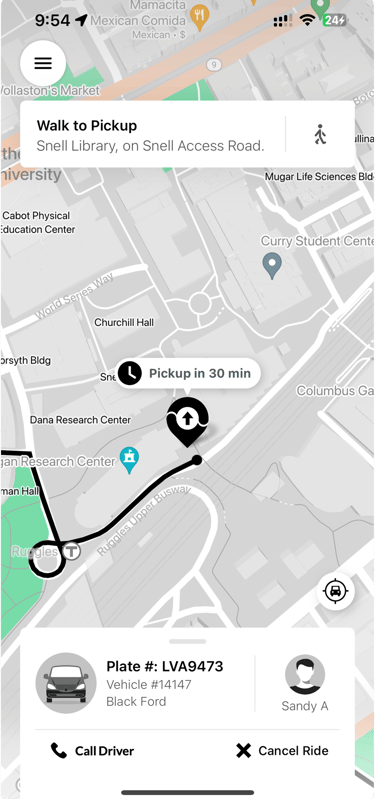
What is RedEye?
Redeye is the commuting service that is currently provided to students who are traveling back home from the university outside the campus from
5 pm to 6 am.
More than 3,300 students used the service for 45,000 rides in the 2018-2019 academic year.
Over a period of 11 weeks, I did a 3-part project on the RedEye application as part of my methods for global user experience course at Northeastern University.
Key Issues
The two main challenges that were addressed through this research were the current user frustration while booking a ride and the reasons for its low adoption rate among students.


Redesign Objective
Understand why there is a low adoption rate among students, who stay outside the campus. To uncover the reliability and accuracy of transportation information provided by the application, including real-time updates on bus schedules and routes. Through this research process, I hope to understand user perspectives, preferences, and challenges with RedEye.
Competitor's analysis features
RedEye's strategic advantage lies in its specialized focus on safety within the Northeastern University community. Deep integration with university infrastructure and specialized safety features create a sense of trust and security among students and staff.
Where as TransLoc Rider and TripShot offer valuable transportation services, they cater to different university campuses with broader commuting needs.


Research questions
Surveys
61 participants participated in the survey
49 of those participants were Graduate students
10 questions total
Survey goals
Understand the challenges faced by current RedEye users.
Assess awareness levels and usage ratio among the target audience.
Identify reasons for non-usage and barriers to adoption.


Initially, I created the survey logic as a mind map on Mural, where I collaborated with my professor and received valuable feedback. Based on the feedback, I decided to use the 5-point Likert scale to understand the user's current experience. Since Northeastern community members can access Qualtrics to create surveys for academic, research, and administrative purposes, I created a survey on the platform using 2 survey logics:
one for current users to provide feedback based on their experience and another for non-users to understand why they don't use the app.
Surveys Logic


Surveys results – suggestions
When Asked
If you had a magic wand and could improve any aspect of Redeye, what would you do?
A few common themes emerged
Communication
“I would improve on the communication between the driver and the students boarding . Sometimes, Students feel that the drivers take quite a while to arrive at the spot, if the students had an option to contact the driver to know where are they are it would help improve the experience.”
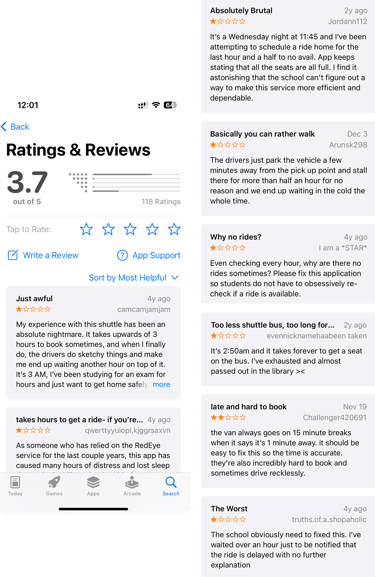
Availability
“Most of the time when I request a ride, they say they are experiencing "unusually high demand" and there are no rides available. It can't always be "unusually high" they just don't have enough vans available.”
Pick up & Drop
“Adequate resources to meet the needs of students. It would also be nice to have alternate pick-up spots on campus. Why do you have to enter you're 'from' destination if the only option is Snell Library?”
User Interview
Goals
Identify common pain points
Gather suggestions for improving the service.

Process
I conducted 4 user Interviews, where I mainly focused on understanding their usage patterns, satisfaction levels, and suggestions for improvement. The interview notes were analyzed to identify recurring themes and areas of concern. Commonalities among user experiences and suggestions were identified.


Recommendations
Enhanced Communication with Drivers
Provide an option to contact the driver to know where they are or if they are getting delayed.
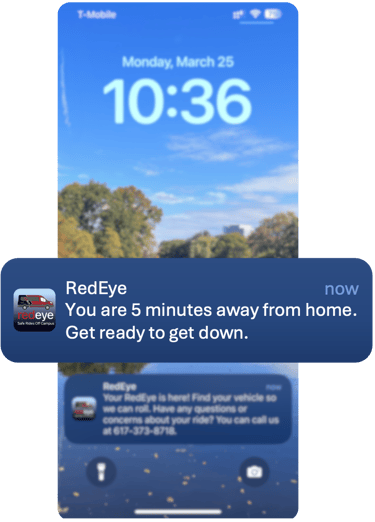
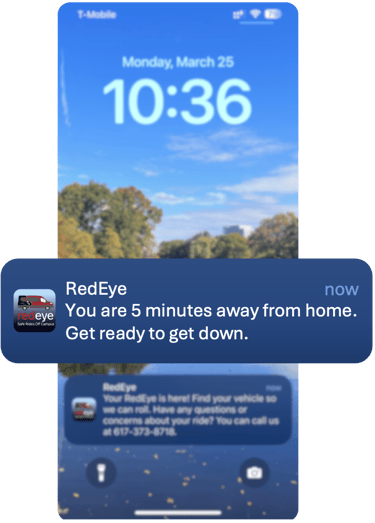
Notification suggestion
A notification feature to alert passengers when their stop is approaching.
Option to make a group booking while booking a van by multiple users going to a similar location
Default Pick-up Location, mentioned by 50% of respondents.

Information contained within the projects is solely my own and may not necessarily align with the perspectives of the respective companies.
All projects adhere to the terms of any NDAs Signed.